- EUR/USD extends its five-day rally, trades above 1.1600.
- A weaker dollar boosts the EUR/USD pair, despite surging US 10-year yields, above 1.641%.
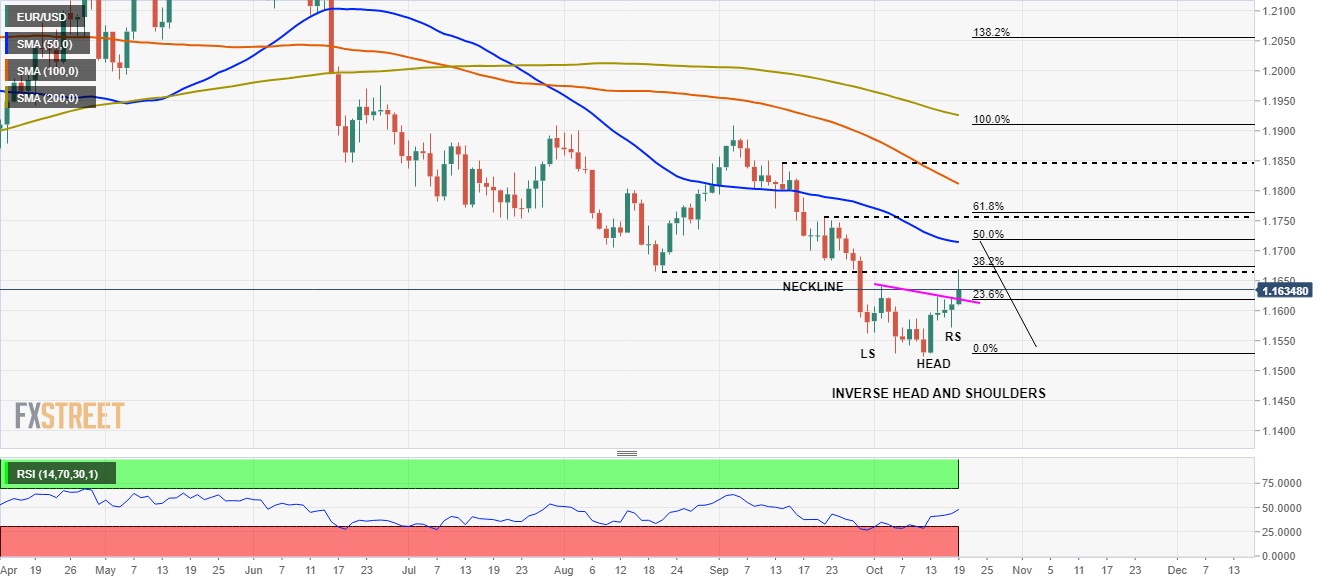
- EUR/USD: The target of an inverse head-and-shoulders is 1.1750, but first, euro bulls need to reclaim 1.1700.
The EUR/USD climbs during the New York session, up some 0.22%, trading at 1.1636 at the time of writing. The market sentiment remains upbeat, as major US stock indices record gains between 0.46% and 68%, while the safe-haven status of the US dollar weakens across the board.
The euro extended its five-day rally, though weaker, reclaimed the 1.1600 figure. The US dollar sell-off witnessed the US Dollar Index drop below the 94.00 threshold despite higher US T-bond yields, with the 10-year coupon, rallying almost six basis points, sitting at 1.641%, at press time.
EUR/USD Price Forecast: Technical outlook
The daily chart of the EUR/USD shows that an inverse head-and-shoulders formed around the 2021 lows, indicating the EUR/USD is under some buying pressure. The inverse head-and-shoulders pattern measured target is 1.1750, near the 50% Fibonacci retracement, which could resume the long-term downward move towards a renewed test of 2021 lows.
To challenge US dollar bulls, euro buyers will need a daily close above 1.1800, near the 100-day moving average (DMA). In that outcome, the September 14 high at 1.1846 would be the first resistance level, followed by the 1.1900.
On the flip side, to resume the downward trend, US dollar bulls will need to push the EUR/USD below the 1.1600 threshold. If EUR/USD sellers exert enough pressure to spur a daily close below 1.1600, a challenge of the 2021 lows around 1.1524 is on the cards.
The Relative Strength Index (RSI), a momentum indicator, is at 48, trending slightly up, indicating that buying pressure is piling on the EUR. However, caution is warranted, as the RSI remains below the 50-midline.
Information on these pages contains forward-looking statements that involve risks and uncertainties. Markets and instruments profiled on this page are for informational purposes only and should not in any way come across as a recommendation to buy or sell in these assets. You should do your own thorough research before making any investment decisions. FXStreet does not in any way guarantee that this information is free from mistakes, errors, or material misstatements. It also does not guarantee that this information is of a timely nature. Investing in Open Markets involves a great deal of risk, including the loss of all or a portion of your investment, as well as emotional distress. All risks, losses and costs associated with investing, including total loss of principal, are your responsibility. The views and opinions expressed in this article are those of the authors and do not necessarily reflect the official policy or position of FXStreet nor its advertisers. The author will not be held responsible for information that is found at the end of links posted on this page.
If not otherwise explicitly mentioned in the body of the article, at the time of writing, the author has no position in any stock mentioned in this article and no business relationship with any company mentioned. The author has not received compensation for writing this article, other than from FXStreet.
FXStreet and the author do not provide personalized recommendations. The author makes no representations as to the accuracy, completeness, or suitability of this information. FXStreet and the author will not be liable for any errors, omissions or any losses, injuries or damages arising from this information and its display or use. Errors and omissions excepted.
The author and FXStreet are not registered investment advisors and nothing in this article is intended to be investment advice.
Recommended content
Editors’ Picks
AUD/USD hovers around 0.6500 amid light trading, ahead of US GDP

AUD/USD is trading close to 0.6500 in Asian trading on Thursday, lacking a clear directional impetus amid an Anzac Day holiday in Australia. Meanwhile, traders stay cautious due ti risk-aversion and ahead of the key US Q1 GDP release.
USD/JPY finds its highest bids since 1990, near 155.50

USD/JPY keeps breaking into its highest chart territory since June of 1990 early Thursday, testing 155.50 for the first time in 34 years as the Japanese Yen remains vulnerable, despite looming Japanese intervention risks. Focus shifts to Thursday's US GDP report and the BoJ decision on Friday.
Gold price lacks firm intraday direction, holds steady above $2,300 ahead of US data

Gold price remains confined in a narrow band for the second straight day on Thursday. Reduced Fed rate cut bets and a positive risk tone cap the upside for the commodity. Traders now await key US macro data before positioning for the near-term trajectory.
Injective price weakness persists despite over 5.9 million INJ tokens burned
Injective price is trading with a bearish bias, stuck in the lower section of the market range. The bearish outlook abounds despite the network's deflationary efforts to pump the price. Coupled with broader market gloom, INJ token’s doomed days may not be over yet.
Meta Platforms Earnings: META sinks 10% on lower Q2 revenue guidance Premium

This must be "opposites" week. While Doppelganger Tesla rode horrible misses on Tuesday to a double-digit rally, Meta Platforms produced impressive beats above Wall Street consensus after the close on Wednesday, only to watch the share price collapse by nearly 10%.